I probably should have waited until I hit the 500th edition for this but I was messing around with Claude and looking at the data from the 483 editions of my newsletter that I still have copies of (a few were lost, some were in…lets call them ‘experimental’ formats…and a couple got mangled in the export from Tinyletter). Turns out that comes out at 4925 vacancies over just about a decade of doing this.
Now obviously this data is iffy as it is all based on the 10 vacancies I pick each week so it is dripping with my own biases and in particular the kinds of roles I am interested in.
Still it might be interesting to a few folk.
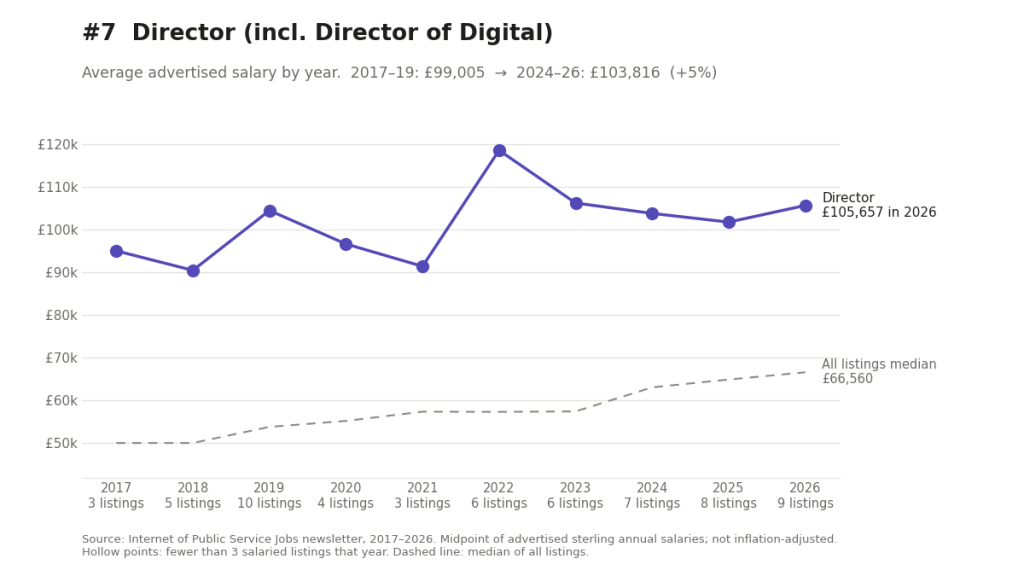
DMs in particular will look at this and feel like they get shafted!
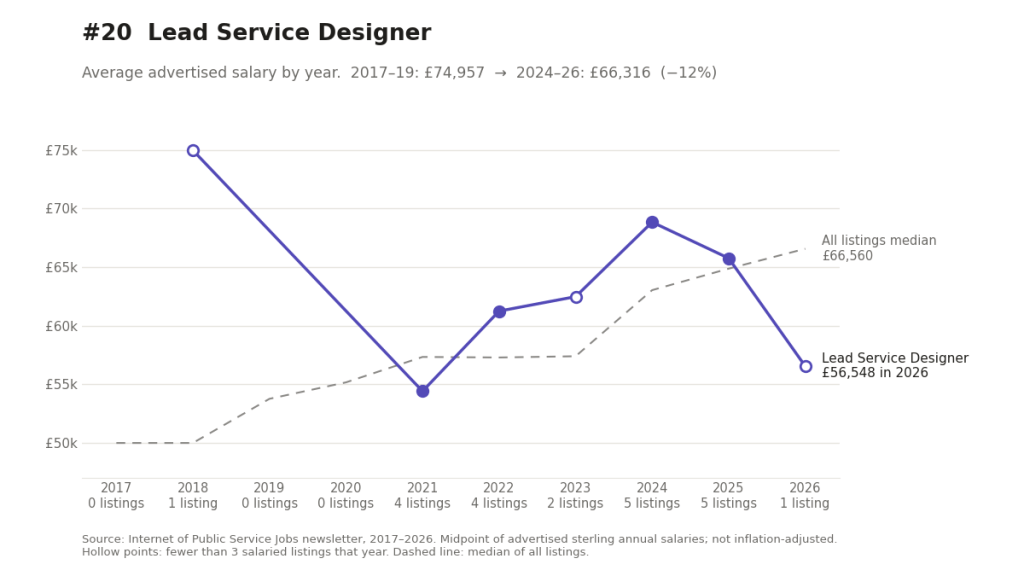
Oh and the ‘Lead Service Designer’ salary trend at [20] is messed up due to a single really high paying role in 2017. I should have fixed that but…
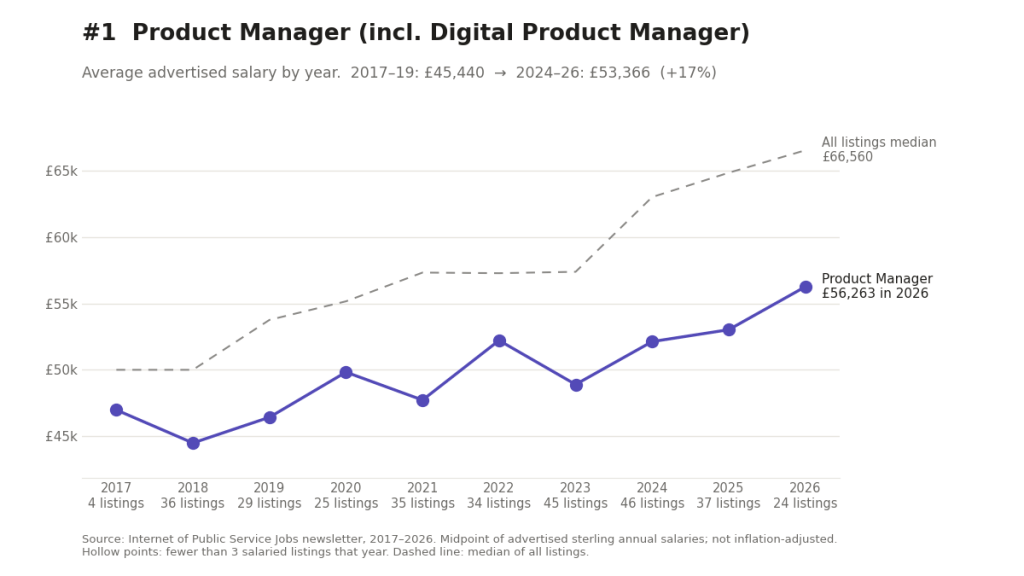
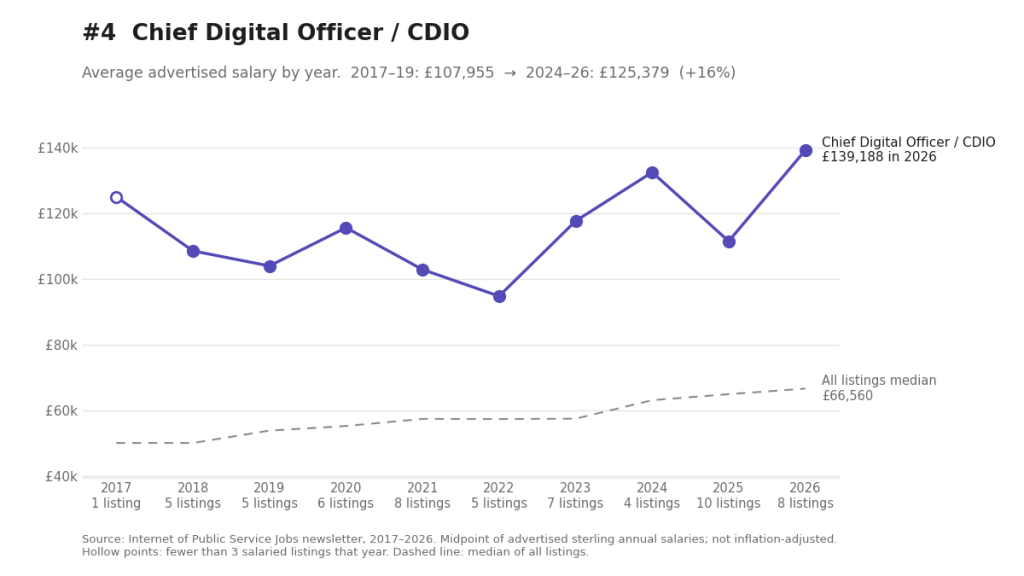
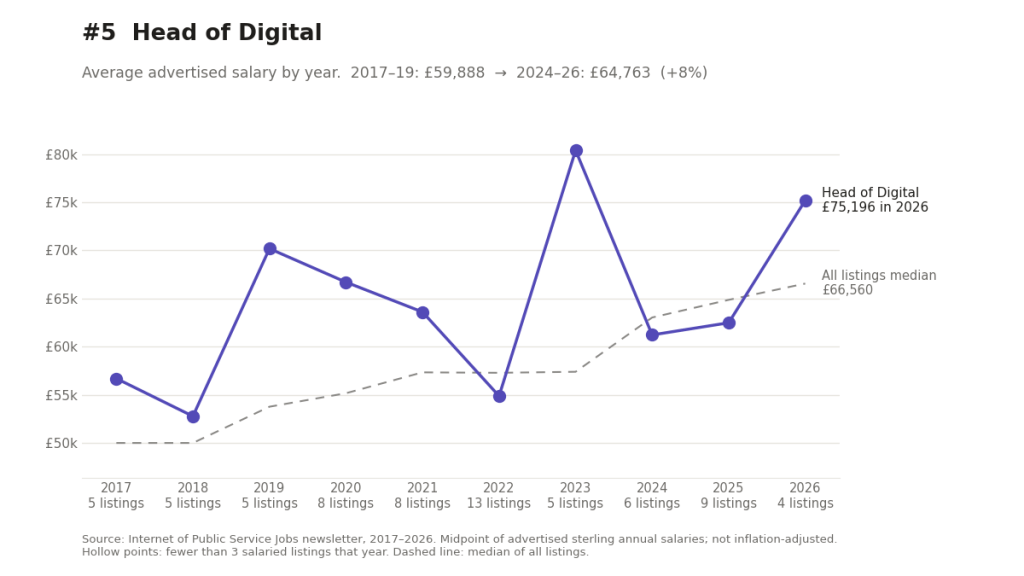
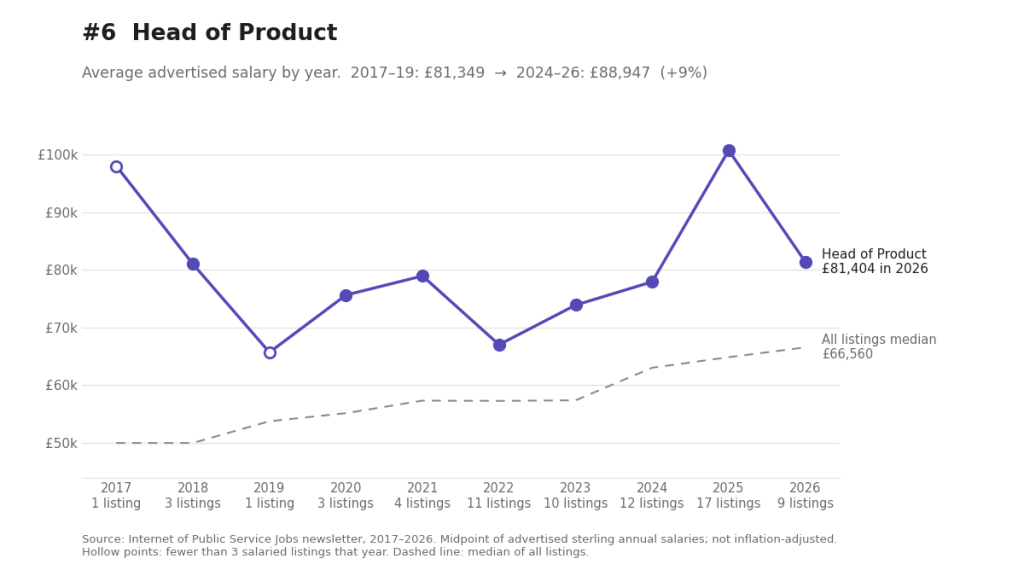
I guess the main takeaway is that ‘internet of public service’ salaries look pretty low across the board really compared to other sectors still. I’ve only really looked at ‘Product Manager’ but that looks a good 10k below what you’d expect elsewhere (based on a combination of my own anecdata and IT Jobs Watch so who knows). They definitely haven’t kept pace with inflation…but what has I guess.
Here is the whole dataset – 10 years of public service digital vacancies.
| # | Job title | Listings | Avg salary (all years) | 2017–19 | 2024–26 | Change |
|---|---|---|---|---|---|---|
| 1 | Product Manager (incl. Digital Product Manager) | 378 | £50,000 | £45,400 | £53,400 | +17% |
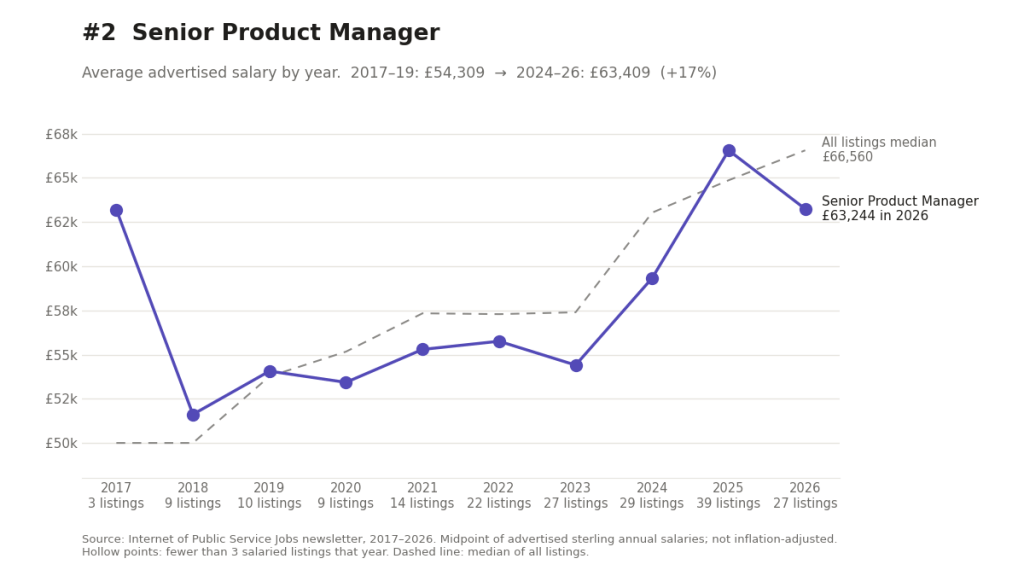
| 2 | Senior Product Manager | 228 | £59,100 | £54,300 | £63,400 | +17% |
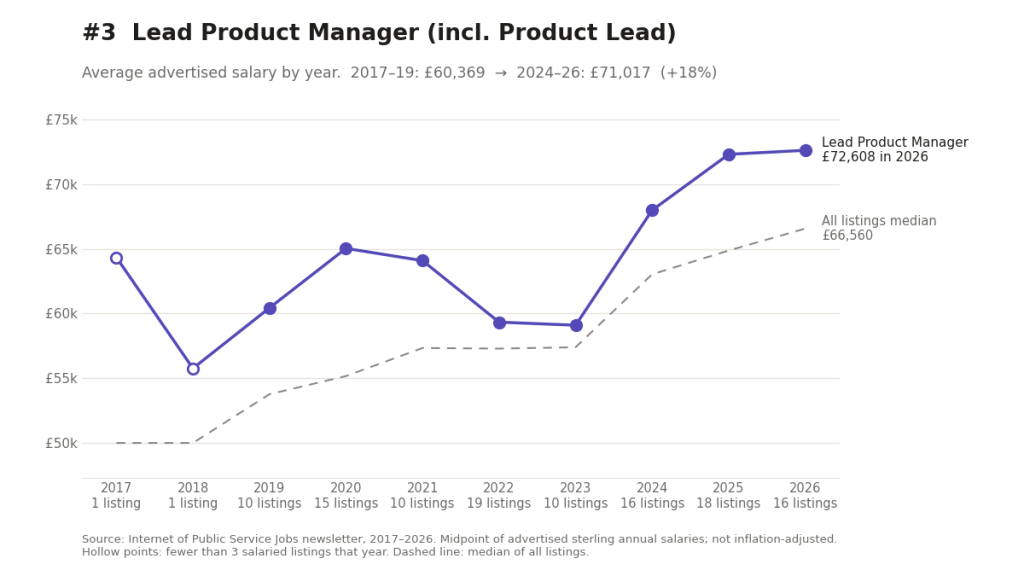
| 3 | Lead Product Manager (incl. Product Lead) | 126 | £65,600 | £60,400 | £71,000 | +18% |
| 4 | Chief Digital Officer / CDIO | 89 | £114,600 | £108,000 | £125,400 | +16% |
| 5 | Head of Digital | 87 | £63,000 | £59,900 | £64,800 | +8% |
| 6 | Head of Product | 84 | £81,800 | £81,300 | £88,900 | +9% |
| 7 | Director (incl. Director of Digital) | 82 | £103,000 | £99,000 | £103,800 | +5% |
| 8 | Senior Delivery Manager | 80 | £56,400 | £53,900 | £58,900 | +9% |
| 9 | Delivery Manager | 79 | £49,300 | £51,200 | £51,000 | 0% |
| 10 | User Researcher | 76 | £40,200 | £38,300 | £44,100 | +15% |
| 11 | Deputy Director (any portfolio) | 73 | £85,700 | £82,500 | £88,900 | +8% |
| 12 | Senior User Researcher | 66 | £52,200 | £50,000 | £54,000 | +8% |
| 13 | Service Designer | 63 | £45,900 | £44,300 | £49,500 | +12% |
| 14 | Senior Service Designer | 61 | £55,500 | £62,000 | £59,700 | −4% |
| 15 | Product Owner | 44 | £52,800 | £52,800 | £54,100 | +2% |
| 16 | Lead User Researcher | 39 | £61,000 | £57,300 | £62,200 | +9% |
| 17 | Senior Content Designer | 38 | £47,400 | £42,100 | £50,600 | +20% |
| 18 | Service Owner | 35 | £68,300 | £60,000 | £73,700 | +23% |
| 19 | Content Designer | 28 | £40,300 | £33,800 | £42,200 | +25% |
| 20 | Lead Service Designer | 27 | £63,300 | £75,000 | £66,300 | −12% |
Based on 4,925 job listings from 483 editions of the newsletter, November 2016 to September 2026. Salaries are advertised figures: the midpoint of each range, sterling annual salaries only, not adjusted for inflation. “Change” compares the average for listings in 2017–19 with 2024–26.
Trends
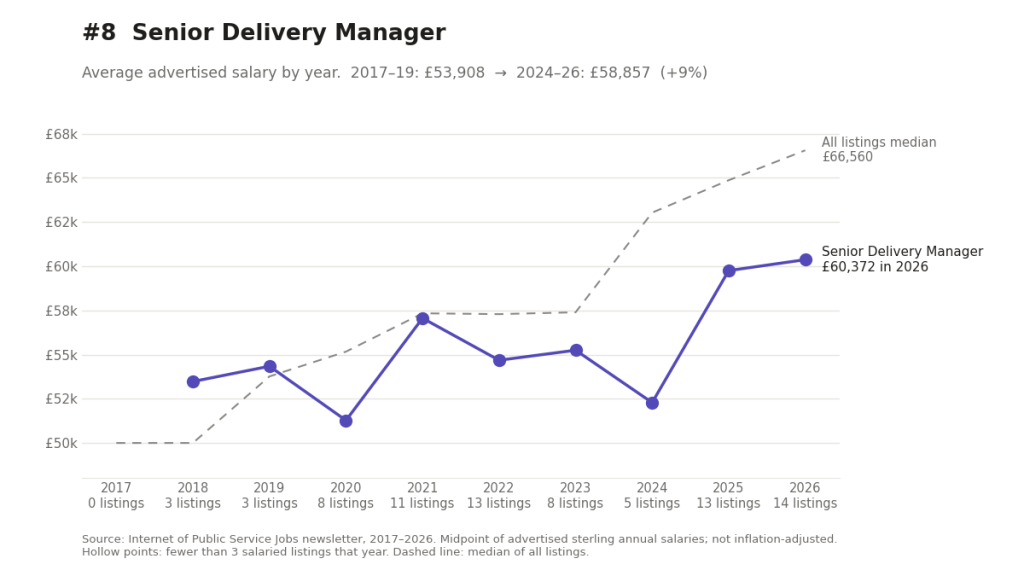
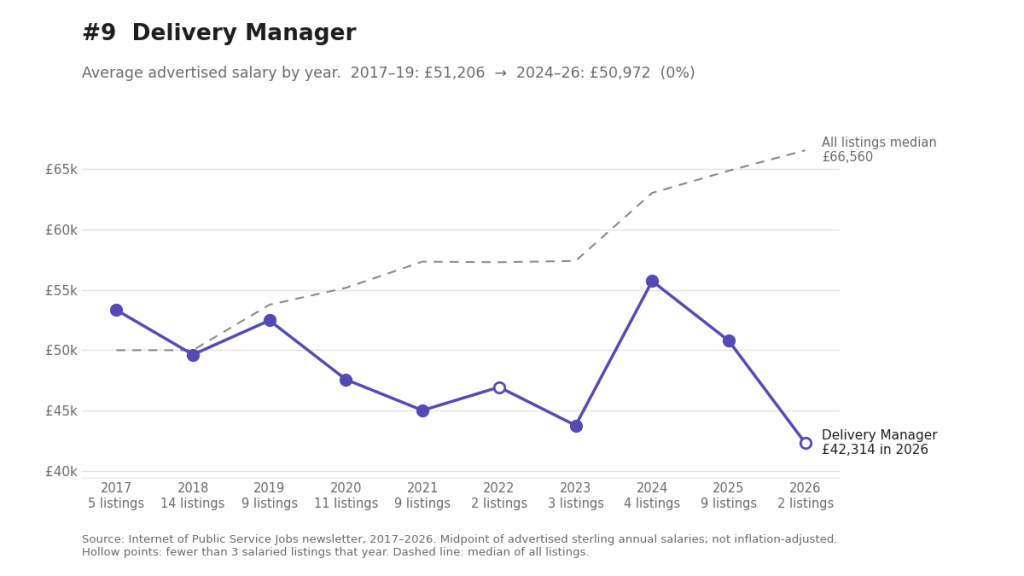
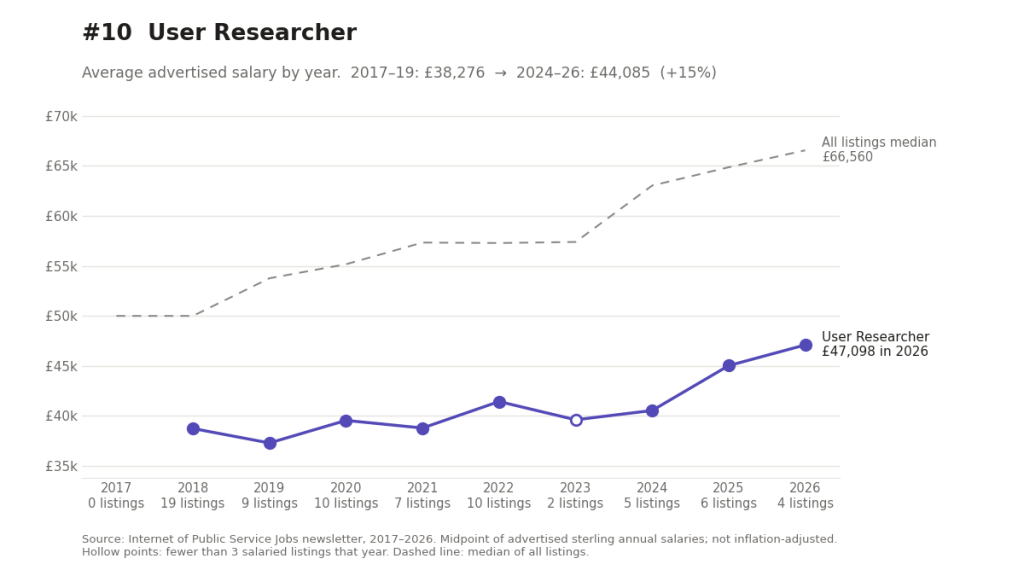
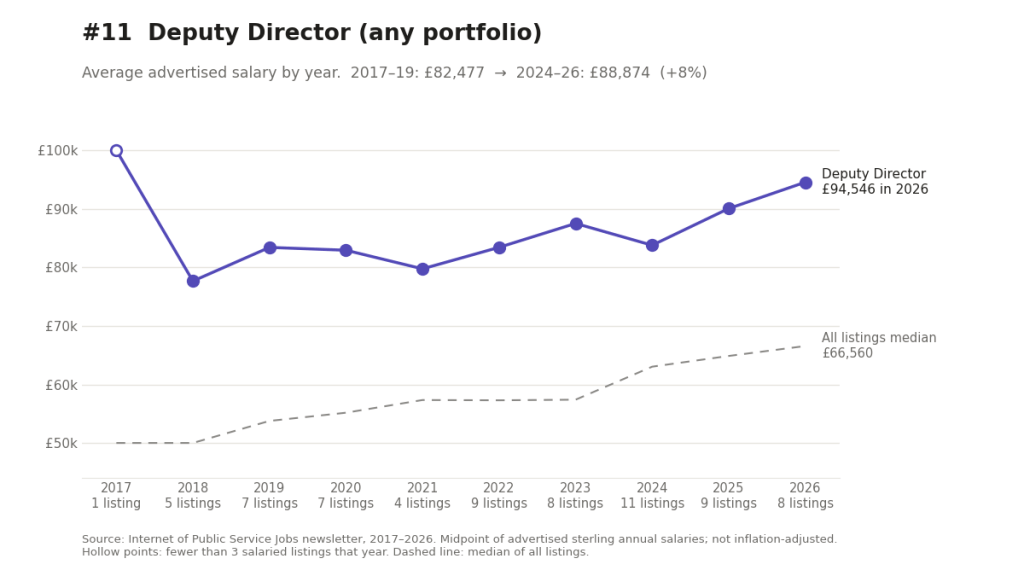
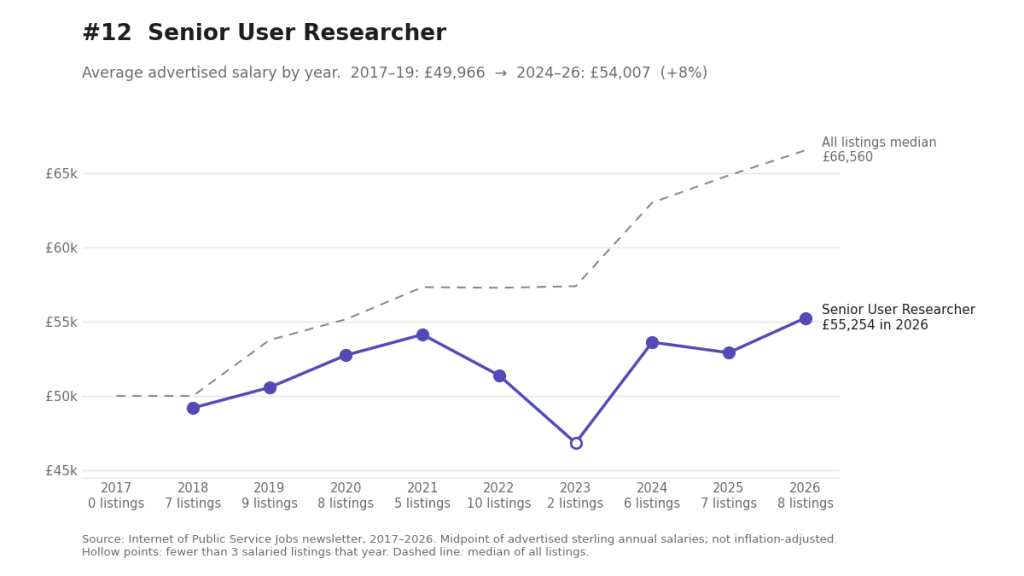
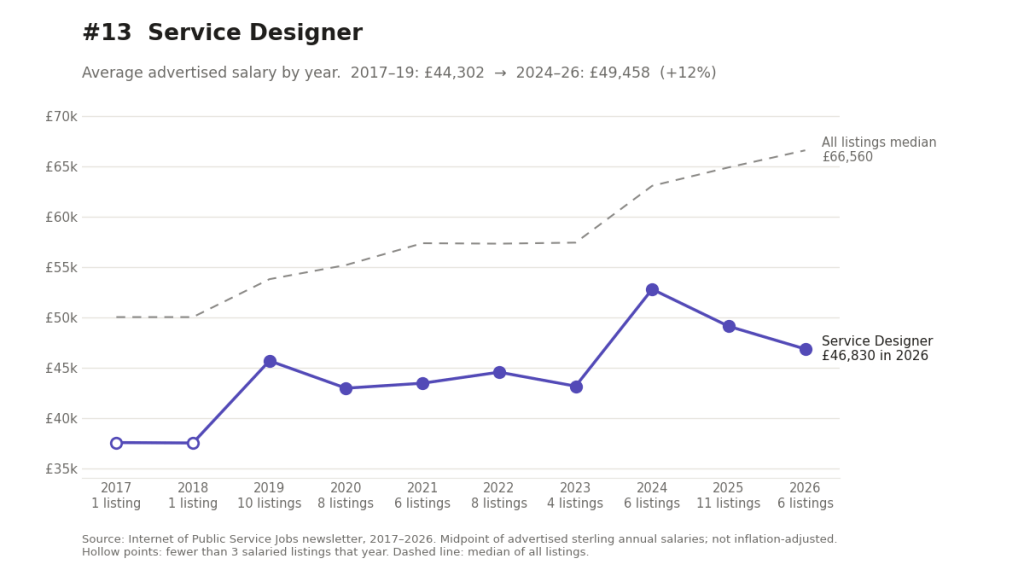
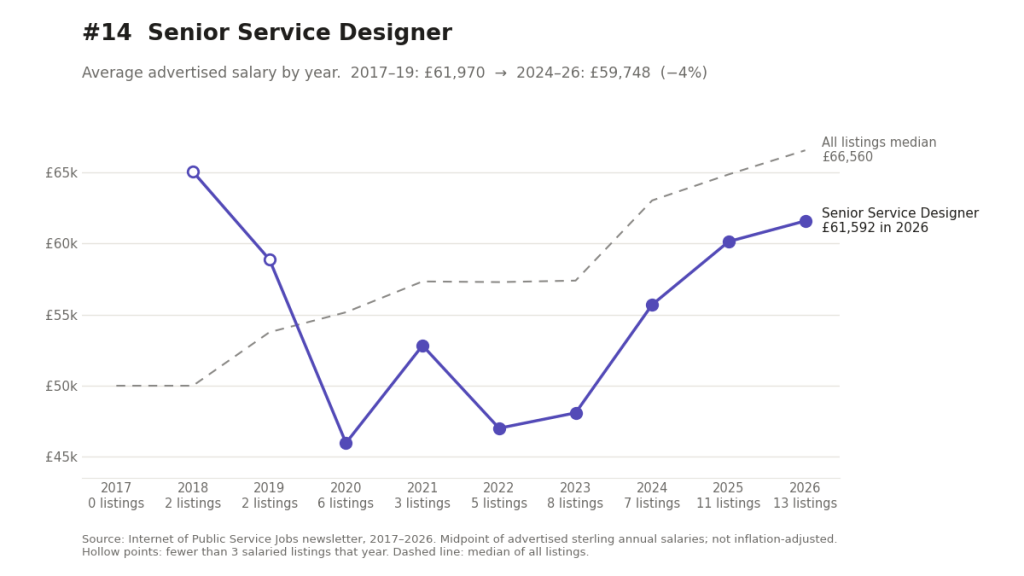
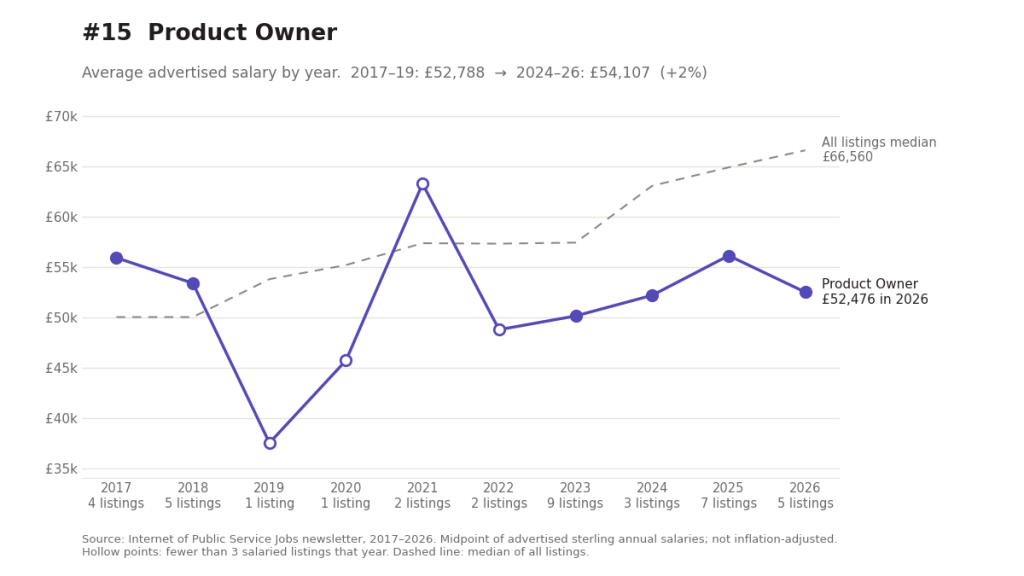
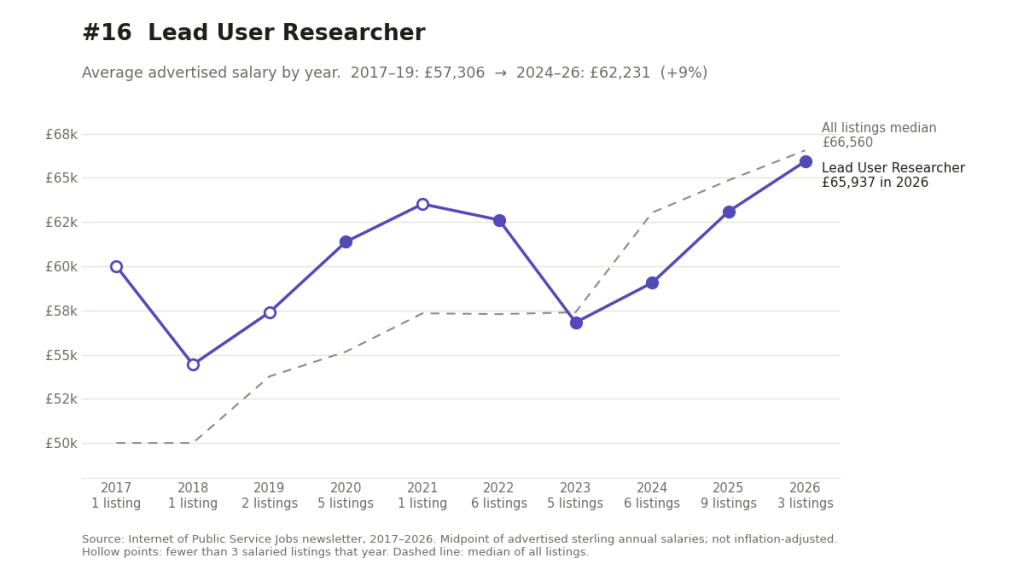
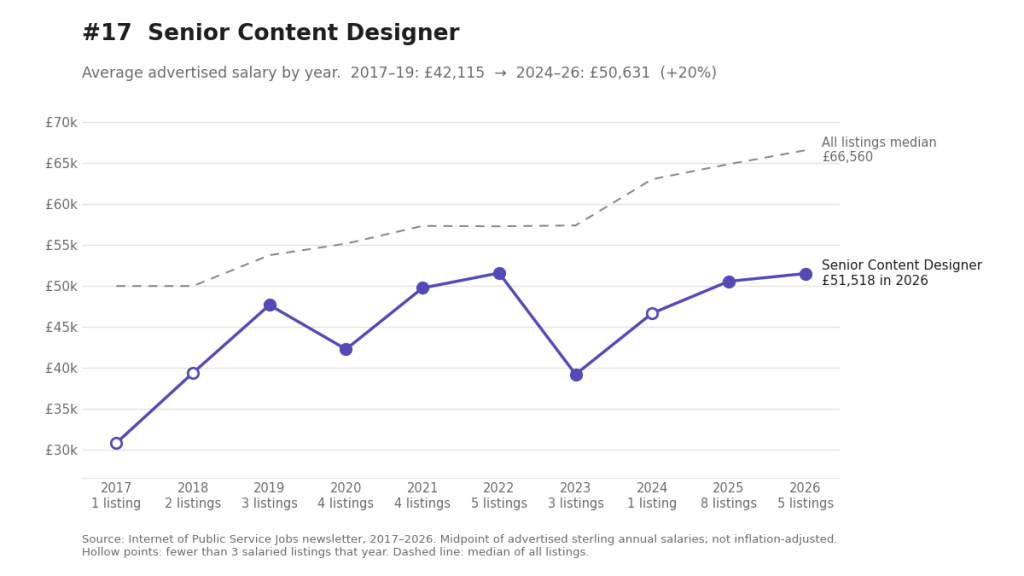
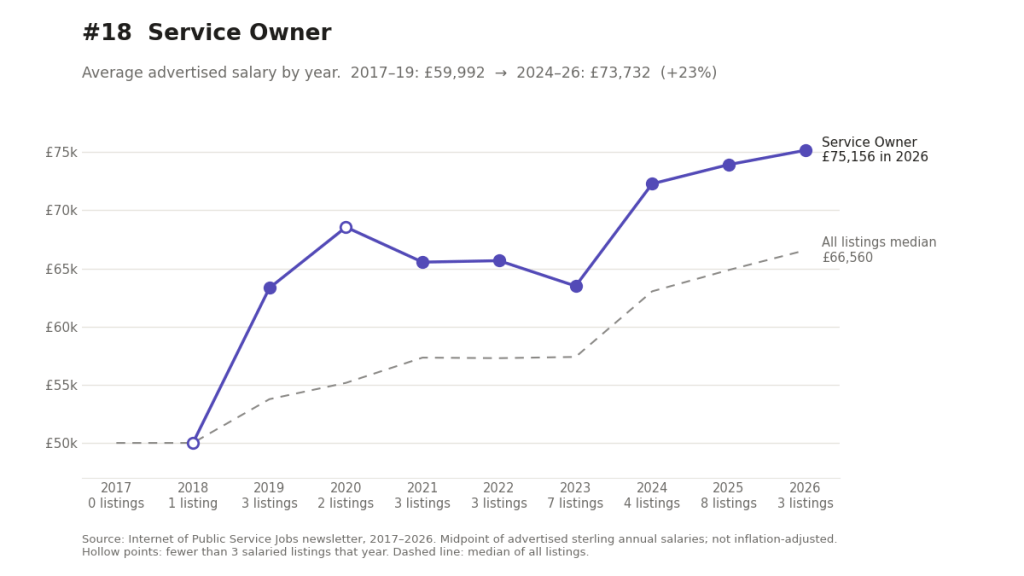
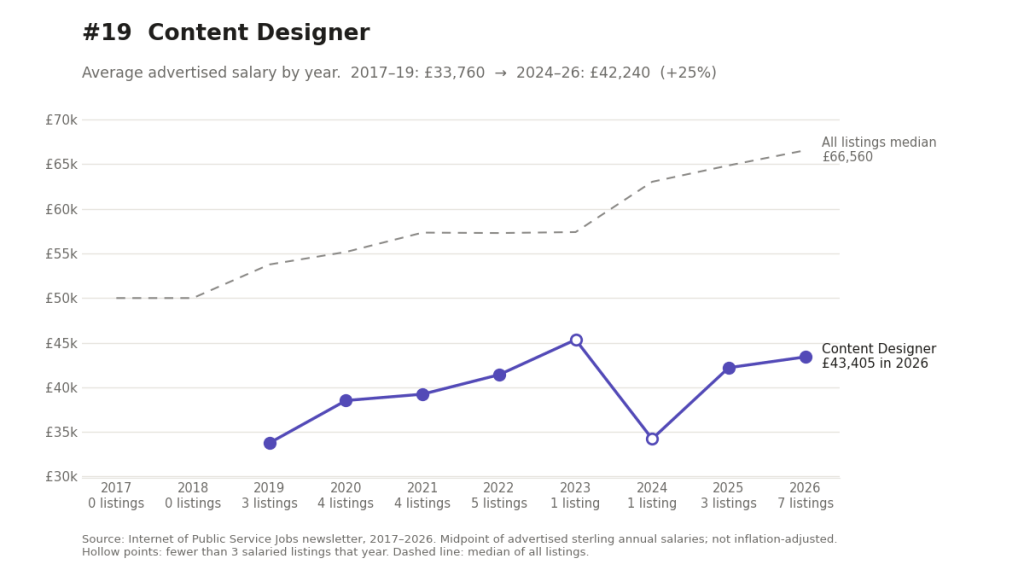
Salaries vs Inflation
This is what Claude had to say about the inflation issue;
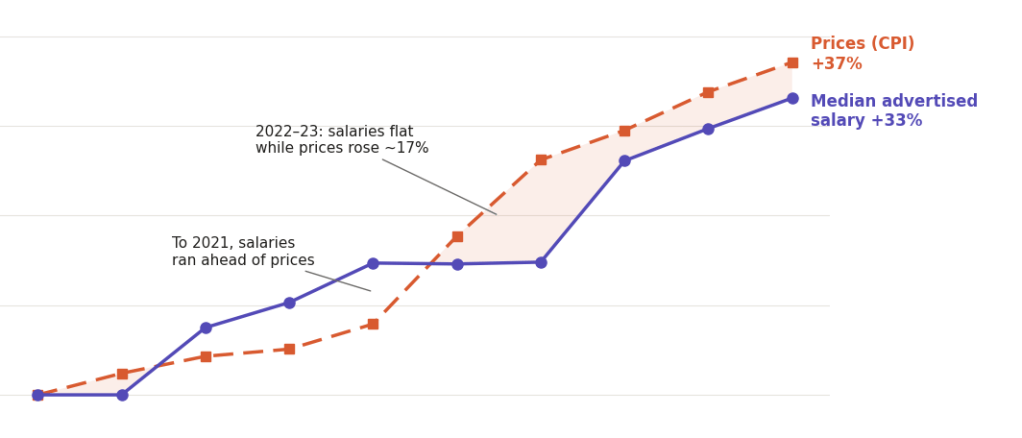
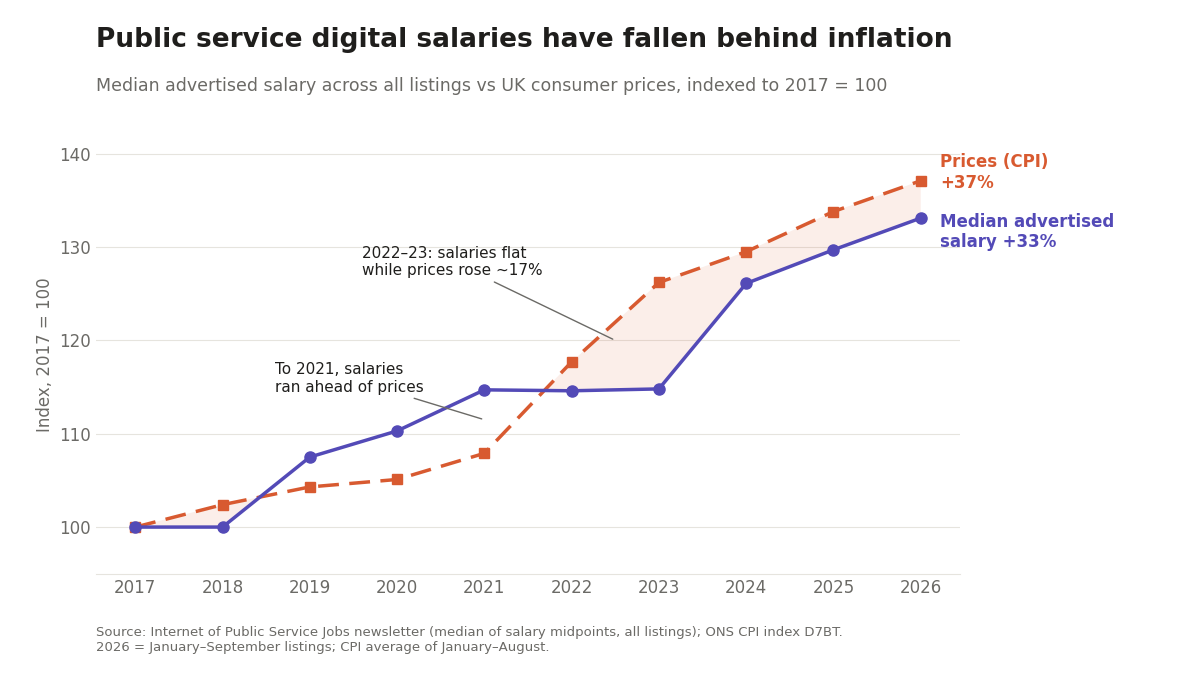
Salaries have not kept up with inflation. Prices (measured by CPI, the UK's official inflation measure) rose about 31% between 2017–19 and 2024–26. Across all listings, the median salary rose 25%. Every one of the top 20 roles is worth less in real terms now than in 2017–19.
How the gap opened (chart above):
2017–2021: salaries ran ahead of prices. By 2021 the median advertised salary was up 15%, while prices had risen 8%.2022–23: salaries stood still while inflation spiked. Prices rose about 17% in two years, and the median salary didn't move. This is where the whole shortfall comes from.2024–26: salaries grew faster than prices again, but not enough to close the gap. By 2026 salaries are up 33% on 2017 and prices 37%.
In today's money, a typical listing in 2017–19 paid £66,900. In 2024–26 it paid £65,000.


One response to “Data diving at Internet of Public Service Jobs”
[…] also did some noodling with the help of Claude and wrote up some analysis about what you can learn from a dataset of 10 years worth of ‘public service digital’ vacancies. I guess the main insight – which is hardly a shock – is the extent to which the […]