‘What is it you actually do?’ is a series of blogpost ‘interviews’ that ask interesting folk working on digital products in and around public service the age old question — ‘what is it you actually do?’. Shamelessly copying from Lifehacker’s ‘How I work’ series and ‘The Set Up’ blog.
Who are you and what do you do and where?
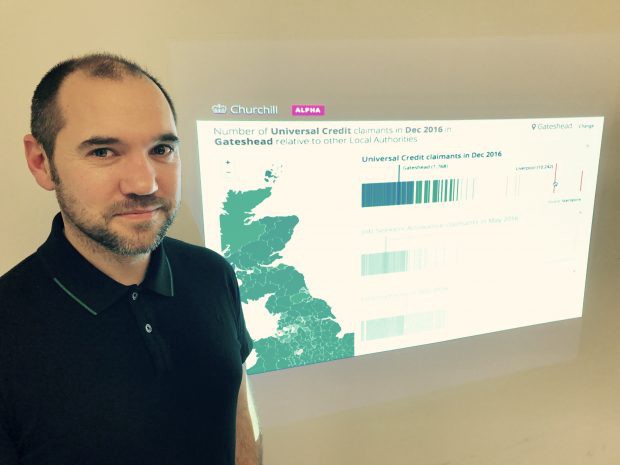
I’m Ryan Dunn and currently I lead the Data Science Hub for the Department for Work and Pensions in beautiful Newcastle. We are effectively an R&D function in the Digital, Data and Analytics part of the department. Our team work very closely with users in strategy, policy and operations to design, prototype and pilot data-driven products to support, inform and transform those areas. In practice I head up a brilliantly talented team. My role involves providing them direction and space to innovate. I join the bigger picture dots and lay the path ahead for the team and products which, as I write it down, sounds more straightforward than it feels in practice.
What software do you use day to day?
Most of the team have two work laptops and switch back and forth between R&D (MacBook) and regular (HP Probook or MS Surface Pro) kit throughout the day. On the regular kit I am somewhat bound to Microsoft products, so Outlook for email, Word, Excel, OneNote, Powerpoint for sketching, sharing, presenting and Lync for cross site comms, show and tells, demos and such like. IE (v9) and Firefox (v45) for web browsing. On our R&D kit I use the iWork equivalents of Pages, Numbers and Keynote — I am a big fan of Keynote. I tend to use Chrome for web browsing on the MacBook. The team use a range of software (and environments). For data science work, Python, R, SAS, Docker, Spark, PostGreSQL. We work very closely with software and data engineers who use Angular Javascript, Java and MongoDB. For data visualisation Qlik Sense (for prototyping), Highcharts and D3. We use Jira for tracking and Confluence for collaboration. As a team we’ve found Slack and Hangouts useful for community building, sharing and conversations. On the commute it’s Spotify or Podcasts whilst reading Twitter. I love Twitter. I find it an incredibly positive environment for connecting, as a starting point for research and for stumbling across useful things shared by inspiring people. As a result I tend to trial various applications that look like they make my life easier — especially in the task, to do list, save for later type space. I have yet to find any that really work for me, which I put down to my INTJ paradoxical personality — and whilst Pocket, Clear and Evernote looked promising — I tend to default to pencil and paper.
What is your favourite stationery?
I rely heavily on the basics. Despite the digital working environment I favour good old fashioned pencil and paper. Ideally 2B for sketching/explaining ideas. My team will testify that I can’t have a discussion without scrawling out ideas. A lot of our products involve data visualisation and I find drawing out concepts is vital to get ideas across. I’ll happily use whatever scrap of paper I have to hand to get ideas out of my head and written down — this will quite often be the back of an envelope or school newsletter. I also love to write notes in pencil — I prefer HB in those cases. I have yet to find a pen that I’m fully happy with, perhaps because I’m a lefty. I have tried — I’ve been through phases of fine line, rollerball, felt tip and had beautiful Cross and Paul Smith pens given as gifts but I now tend to just use free pens from events or conferences. Suggestions welcome! I do carry notebooks but I don’t have a ‘system’. I use these more as places to jot and then I periodically collate and condense. I like paperclips, mini bulldog clips and similar to keep jottings on similar topics together pre-collation. Plastic folders and highlighters are also helpful when putting structure to my scrawling. I do like a post it note and whiteboards, which is probably for the best given the nature of our work.
What do you love/hate most about your job?
Our team is incredible. Genuinely wonderful individuals with a passion for what we do as a department — which is hugely important — and dedication to what we do as a team. In bringing data and digital together we have a real opportunity to transform how we do things, developing insight on demand solutions that work for our users. Its exciting. I’m really proud of the mix we have in terms of skills, experience, background, personalities and gender split. Collectively as a team we trust each other and work incredibly well together. I genuinely reflect on that every day. My job is to set clear vision and direction to an R&D function. I love the flexible strategic thinking that is required in this role, bringing direction and clarity to the uncertainties, harnessing innovation, planning creatively for multiple scenarios. I love problem solving, joining the dots, spotting opportunities. I love change. I am very passionate about and interested in data visualisation. As with all aspects of my job I do a lot of research, I like to learn — Twitter is fantastic for this, I see what thought leaders and top exponents are up to — it delivers where the rest of the internet doesn’t. I really, really, really dislike process and paperwork. I also get very frustrated at silo and small thinking.
How did you become a [data scientist] working in gov?
I‘m a numbers person. I have a Masters in Mathematics and Statistics and a PhD in Operational Research. In DWP I’ve worked on a number of change type data projects and roles such as developing large scale segmentations for Customer Insight and a complete redesign of National Statistics products. As part of the pilgrimage associated with the latter I met Alan Smith — @theboysmithy — at the time head of the Data Visualisation Centre at the Office for National Statistics, now Data Visualisation Editor at the FT. As cheesy as it sounds, if I had to point to a moment that lead me to this role it would be meeting Alan (and Rob Fry — @fryford and Zoe Hartland — @HartlandZoe). That was the lightbulb moment. I’ve always been a little obsessed with democratising data but this was another level. I continued down that path which lead to meeting Andy Kirk — @visualisingdata another huge inspiration. So when DWP set up a Data Science Hub in Newcastle, the combination of my academic background, my experience in government and my emerging data visualisation skill set was a good fit.
How do you manage your backlog (i.e. cards on a wall, Jira, Trello, Sprintly..)?
We operate a mix of Scrum and Kanban in the team depending on the product. We have cards on the wall, we toyed with Trello for a short while but Jira is the weapon of choice.
